
Dignity
We respect the inherent dignity of every person, regardless of faith, identity, background, or circumstance.
For more than 150 years, Catholic Charities has been an integral part of the Twin Cities community, directly serving our most vulnerable neighbors. For us, caring goes beyond belief.
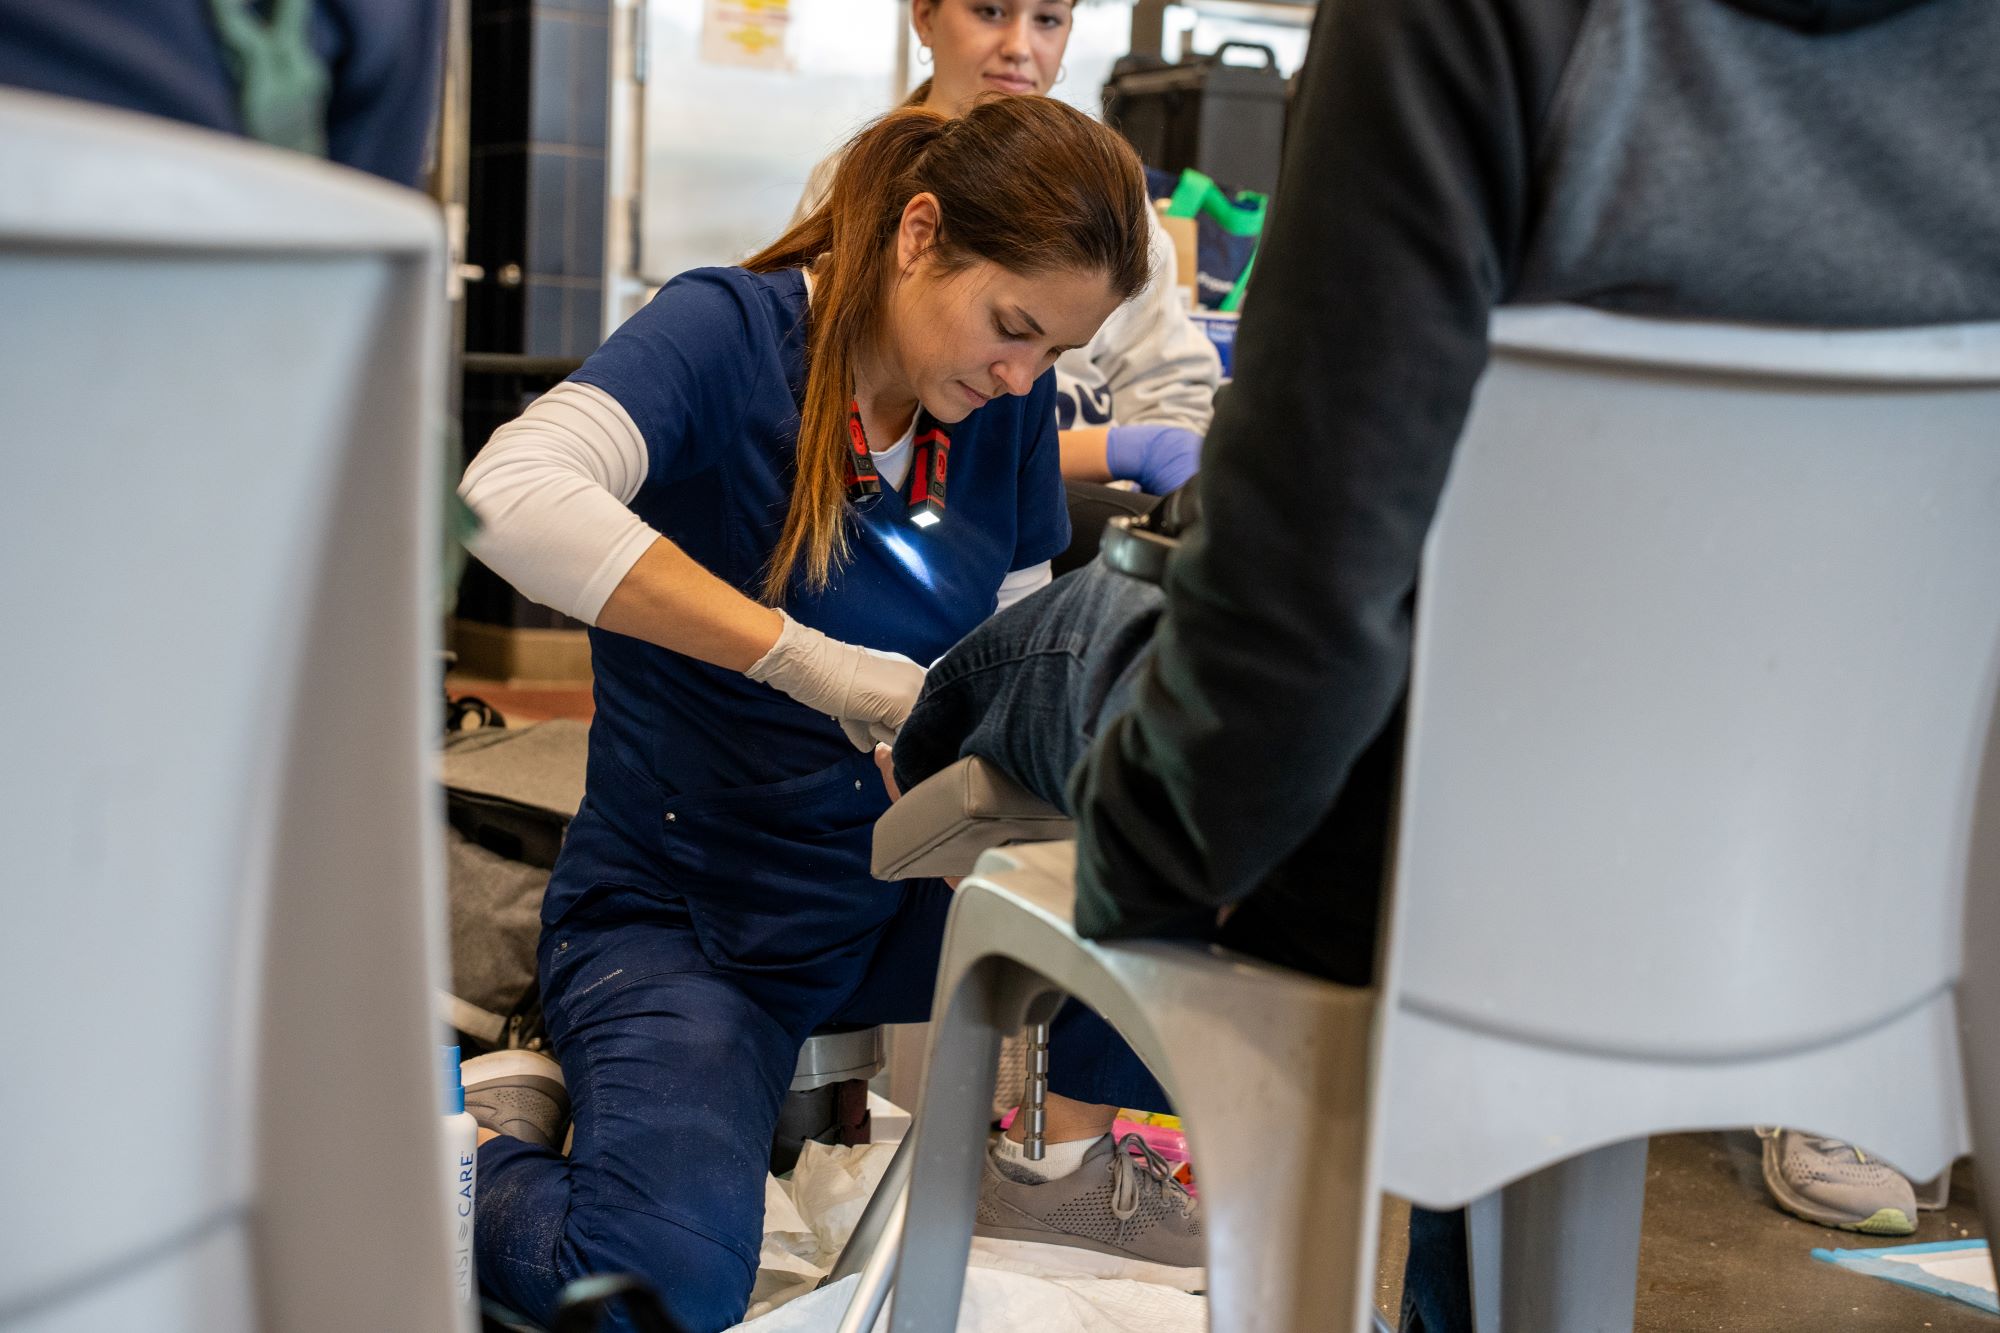
We deliver essential services including affordable housing, emergency shelter, nutritious meals, mental health care, addiction resources, and more. Catholic Charities offers a lifeline to those facing hardship, providing support and developing solutions to build stronger communities. Regardless of faith, identity, background or circumstances, we treat everyone with dignity and respect.
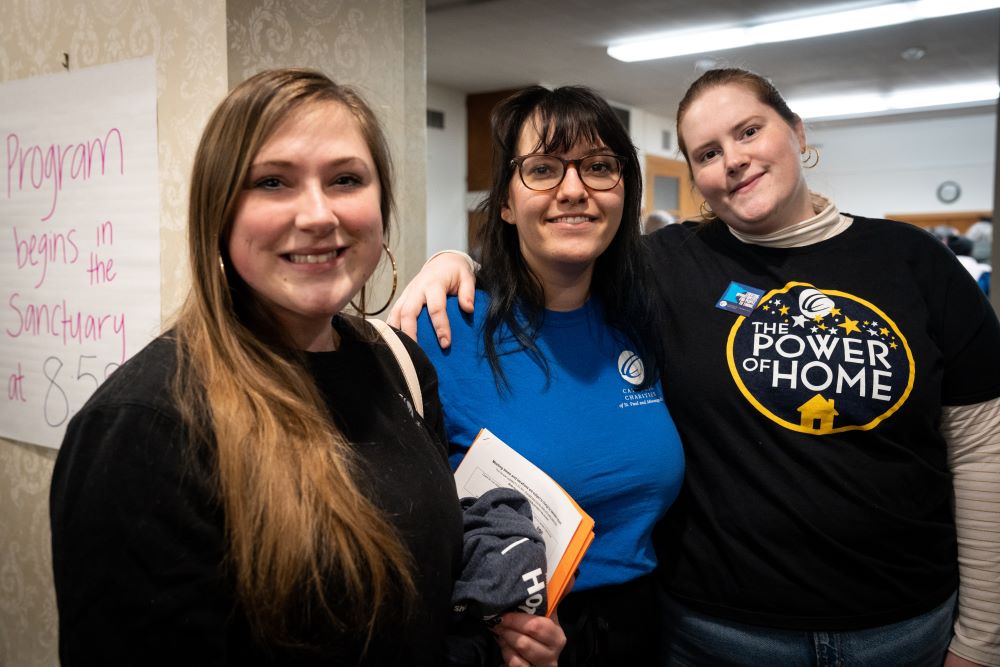
This transformative work wouldn’t be possible without our dedicated staff and the generous support of our donors, volunteers, and advocates.
Our mission is to serve those most in need. We are a leader at solving poverty, creating opportunity, and advocating for justice in the community.
We respect the inherent dignity of every person, regardless of faith, identity, background, or circumstance.

We pursue the common good through building relationships and collaborating across different populations and partners.
We demonstrate compassion and care for people in need of support, prioritizing vulnerable populations.
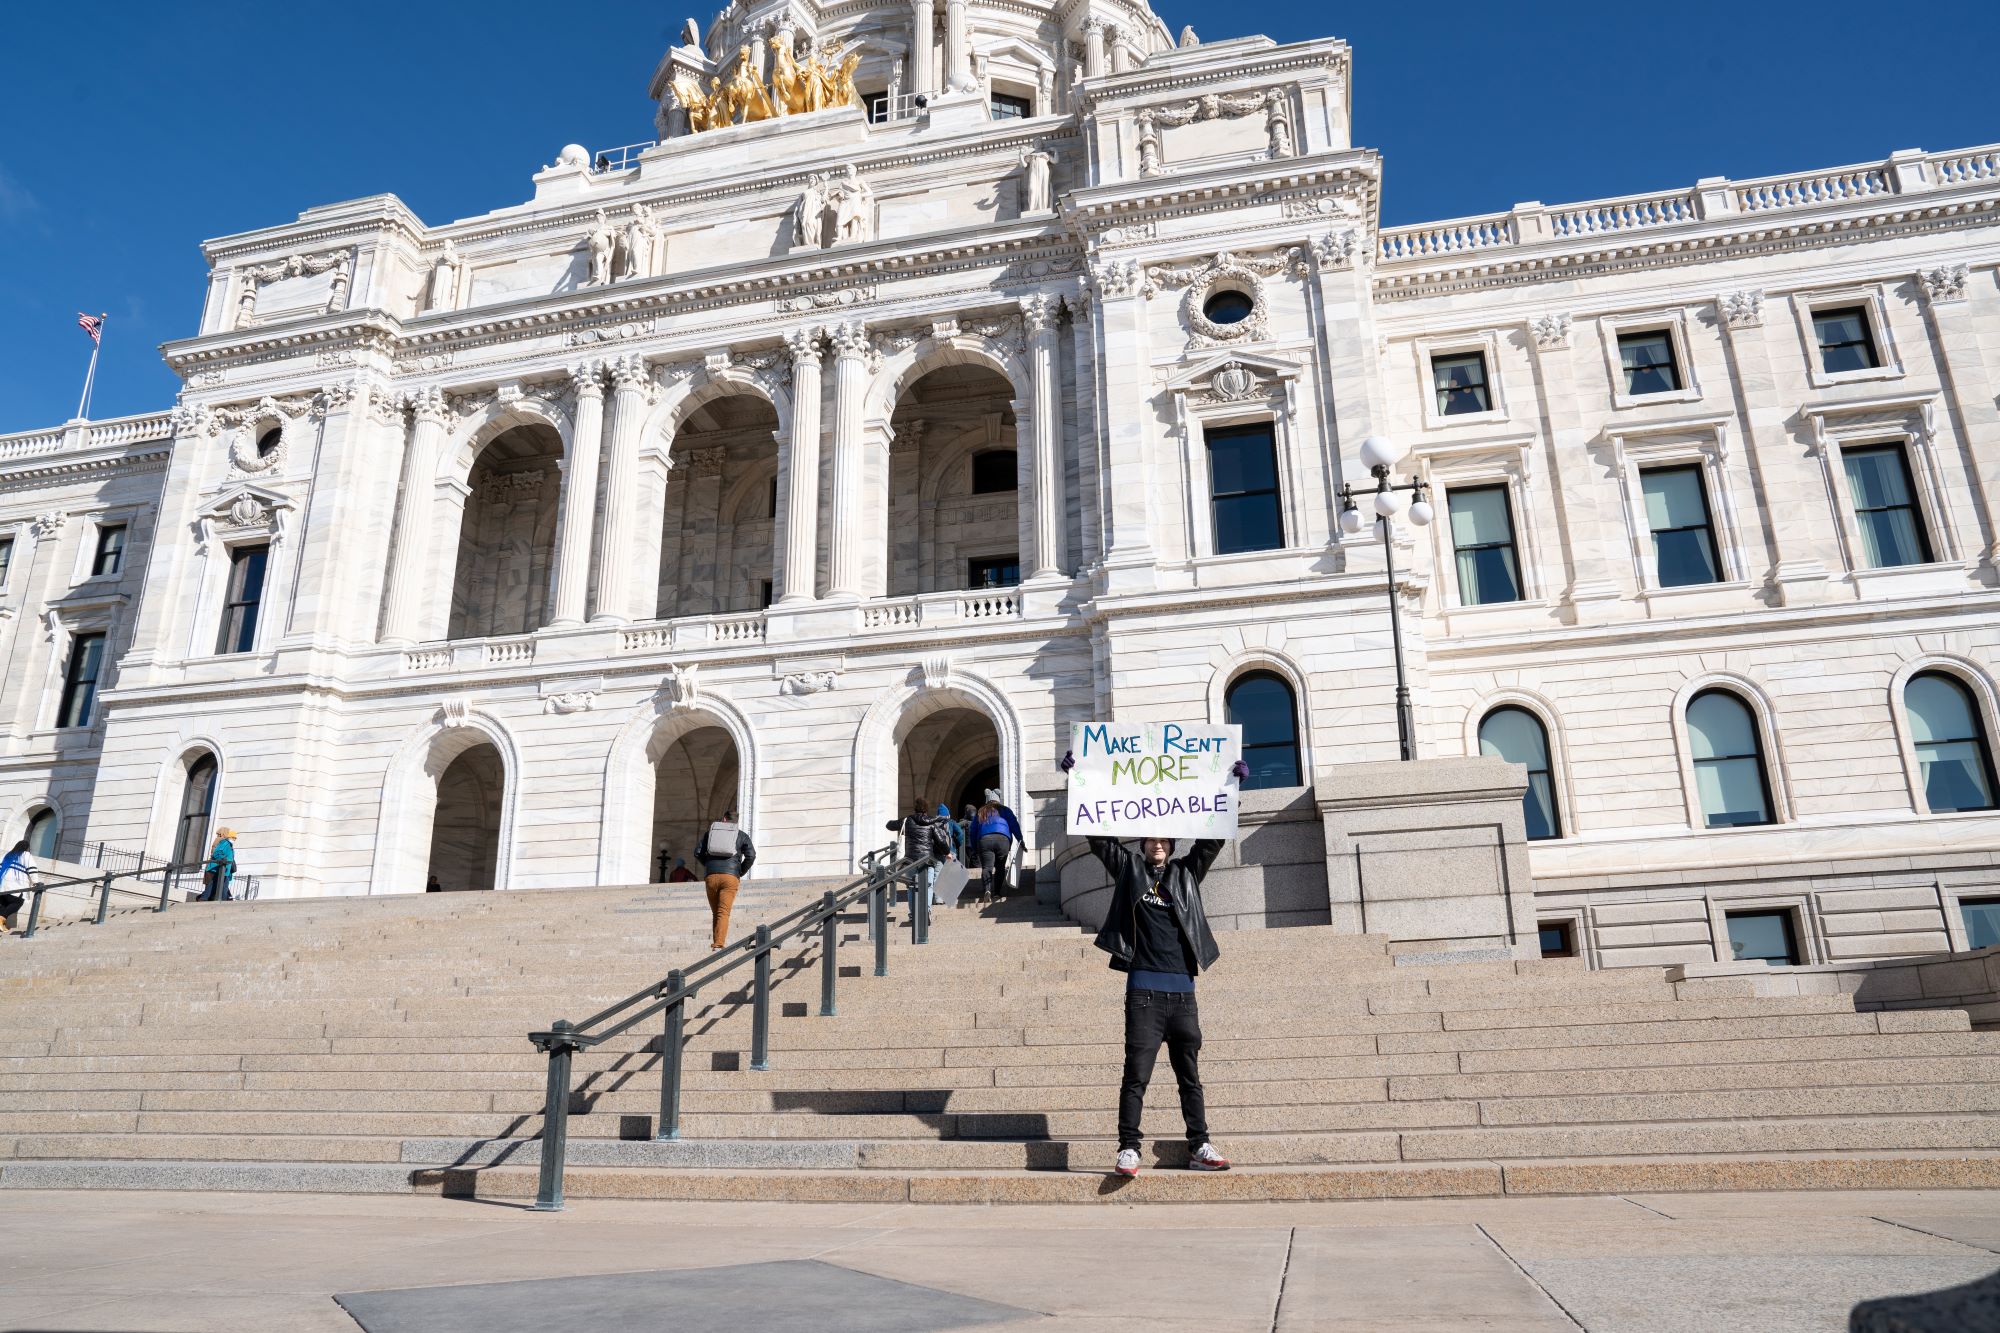
We advocate for justice, recognizing how systems impact the people we serve.
We foster a culture where all can participate in reaching their full potential with choice, voice, and support.
We assume responsibility for our actions and impact by being honest, transparent, reliable, and trustworthy.
We recognize we are all interconnected and must amplify underrepresented voices as we journey alongside those in need.
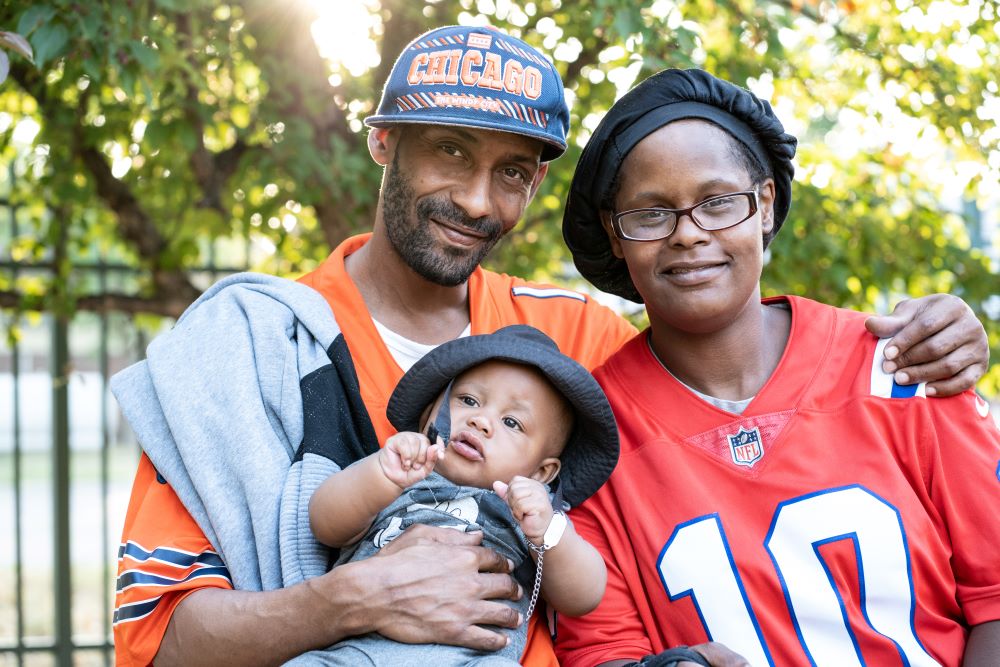
We serve the Twin Cities’ most vulnerable populations: individuals and families experiencing homelessness, hunger, and employment challenges; children in need of care and educational opportunities; and isolated older adults needing support as they age. We partner with local organizations to manage 24 service programs at sites across the Twin Cities metro.
Catholic Charities thrives on the hard work and dedication of our incredible staff, which includes social workers, case managers, program leaders, counselors, mental health practitioners, fundraising specialists, and more. If you have a passion for helping those in need, we’d love to work with you.
Catholic Charities Twin Cities is a member of Catholic Charities USA, one of the largest private networks of social services providers in the country. Browse our annual reports to see our impact over the years.